

Bacterial Chitinase Combo 2 (BC2) [BBa_K3979003] is one of the four recombinant chitinases that we have designed as a part of our project for iGEM-2021. It is a hybrid chitinase engineered by combining the catalytic domain of ChiA [BBa_K3979010] from Amycolatopsis orientalis B-37 and the chitin binding domain of ChiB [BBa_K3979009] from Serratia marcescens QMB1466. The chitinase combo has an approximate size of 1.161 kbp and molecular weight of 43.262 kDa. The approximate PI and extinction coefficient as calculated from ProtParam Tool is 9.47 and 73,590 M-1 cm-1 (assuming all cysteine bonds exist).

Figure 1. Domain Structure of BC2
ChiA [BBa_K3979010] is a wild-type chitinase derived from Streptomyces orientalis (also known Amycolatopsis orientalis) strain B-37 . The chitinase was codon optimised for ease of expression in E.coli BL21 (DE3) using BOOST. Pf-ChiA is an endochitinase capable of hydrolysing and cleaving the (1-4)-beta-linkages in chitin and Chito dextrins. The enzyme has a size of 975 bp and molecular weight of 36.6715 kDa. The approximate PI and extinction coefficient as calculated from ProtParam Tool is 9.39 and 48,150 M-1 cm-1 (assuming all cysteine bonds exist).
The wet lab work plan associated with BC2 and ST can be broadly divided into three steps:
We were able to successfully clone BC2 into the pET28a vector. The BC2 construct and corresponding primers were obtained from IDT. Upon receiving the construct and primers, both were dissolved in autoclaved Milli-Q water for a working concentration of 10ng/μL and 100uM respectively, as instructed by the manufacturer. The working stock of the same was 1 ng/μL and 10 μM respectively.
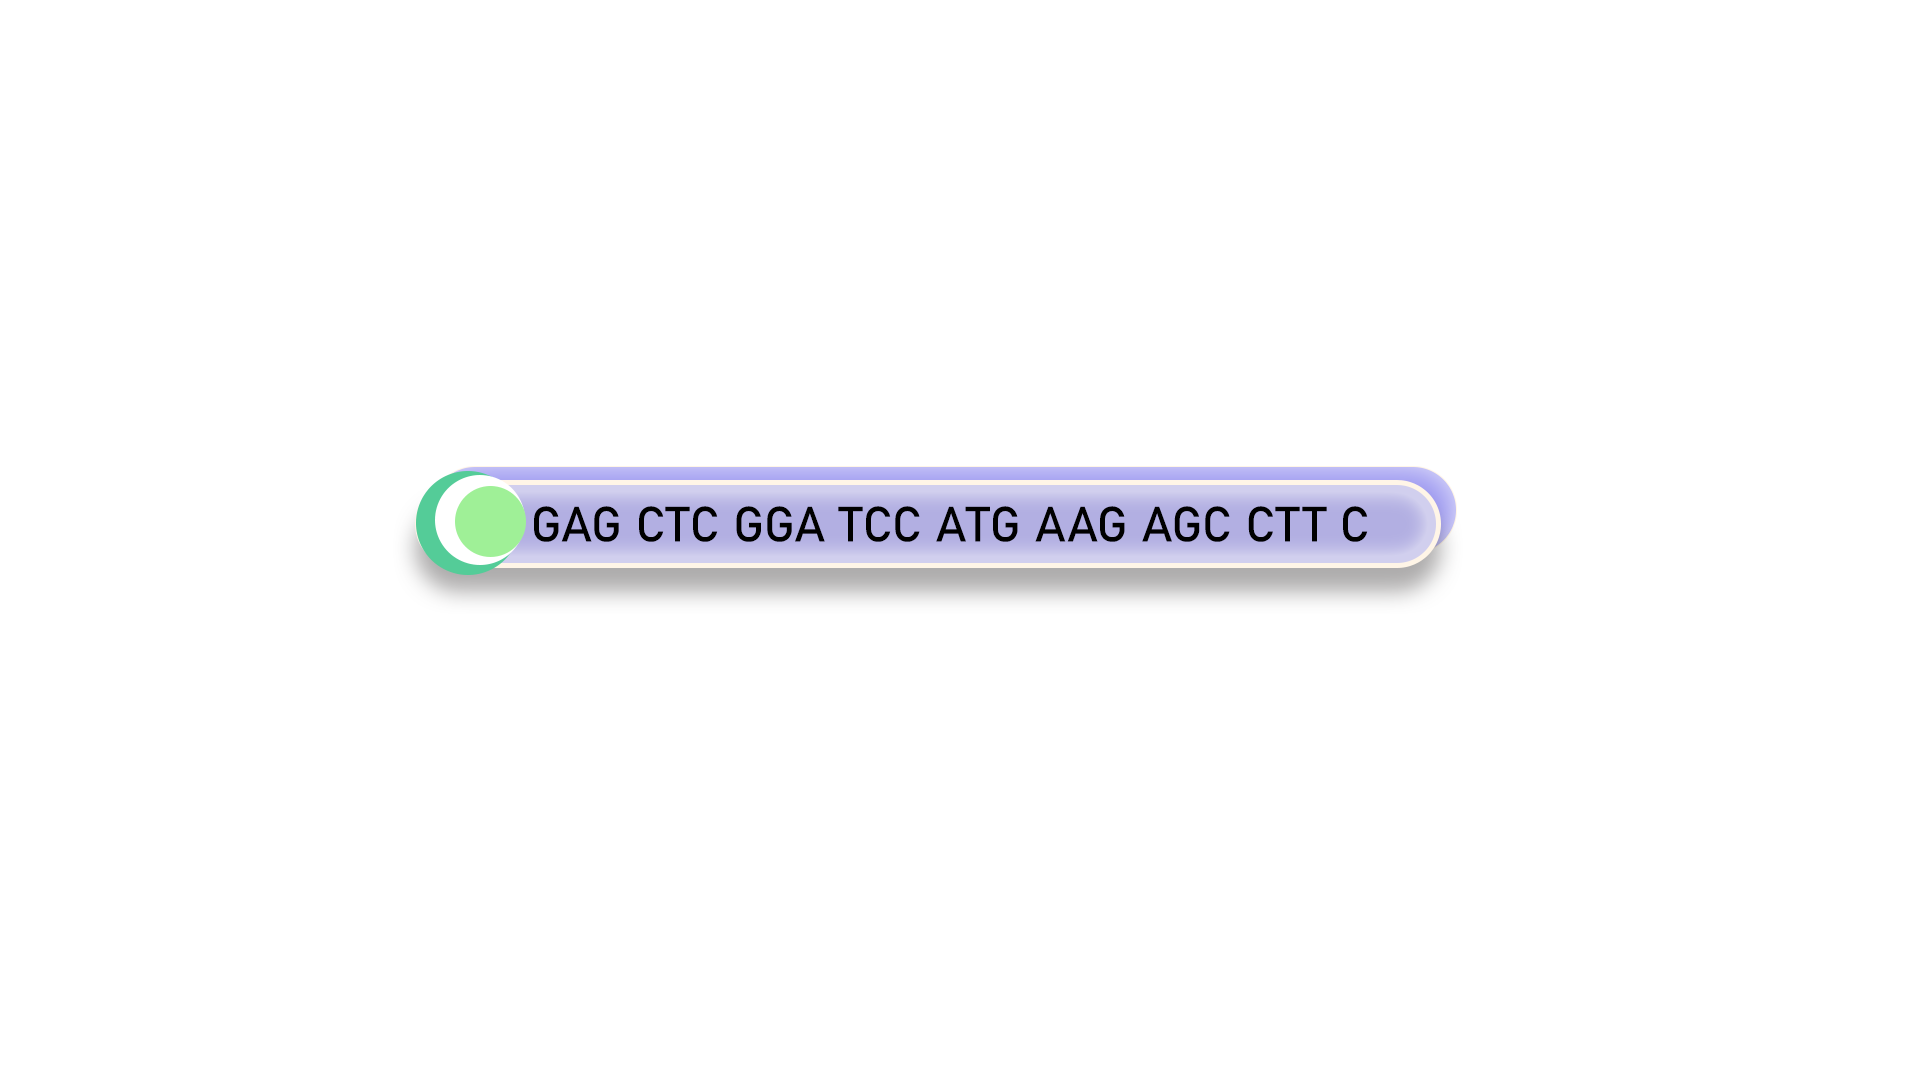
Figure 2. BC2 Forward Primer
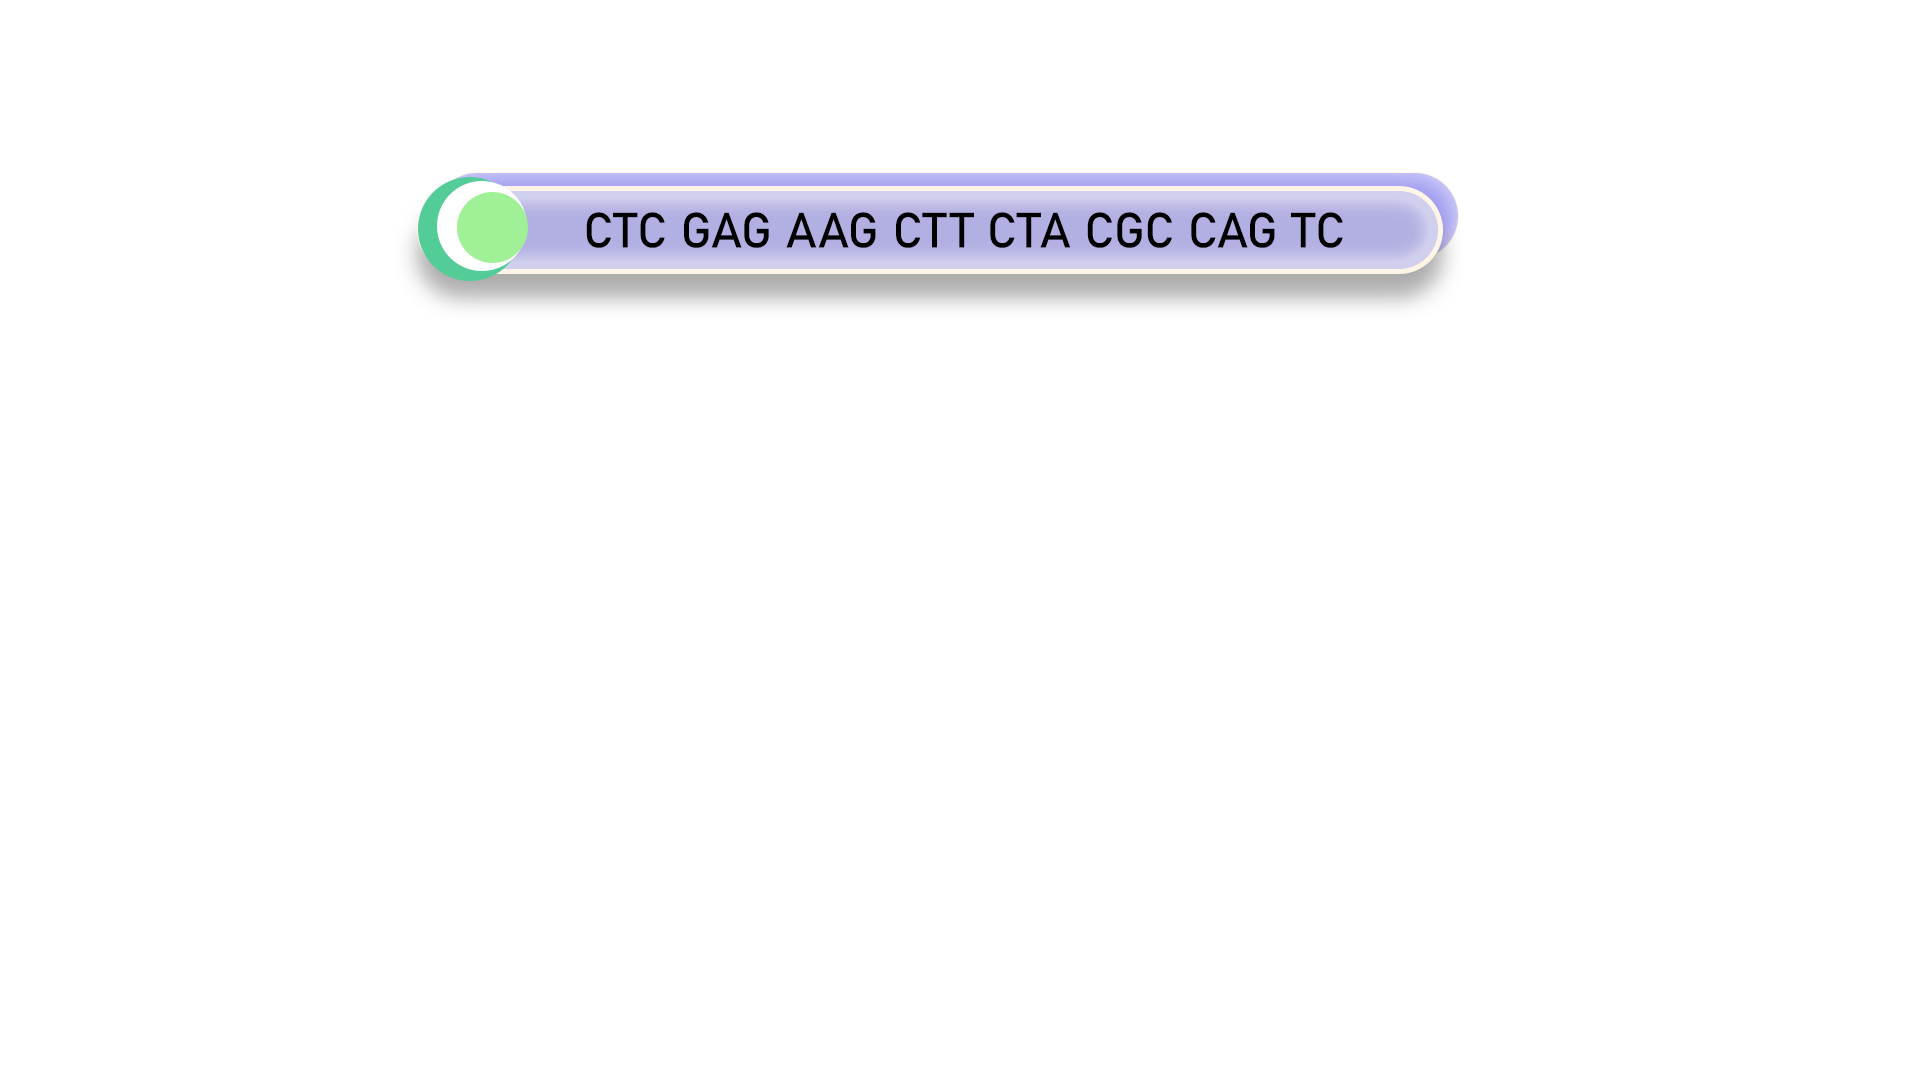
Figure 3. BC2 Reverse Primer
As the first step, we PCR amplified the BC2 construct using KOD polymerase. The melting temperature of the construct was 50℃. PCR conditions were standardized with an initial denaturation at 95℃ for 3 minutes, followed by 35 cycles of denaturation (95℃ for 20 seconds), primer annealing (50℃ for 20 seconds), and extension (70℃ for 1 minute). The final extension was done at 72℃ for 5 minutes. The reaction volume was set at 50μL. PCR was confirmed by performing a 1% agarose gel electrophoresis. The gel image of the same is shown below.
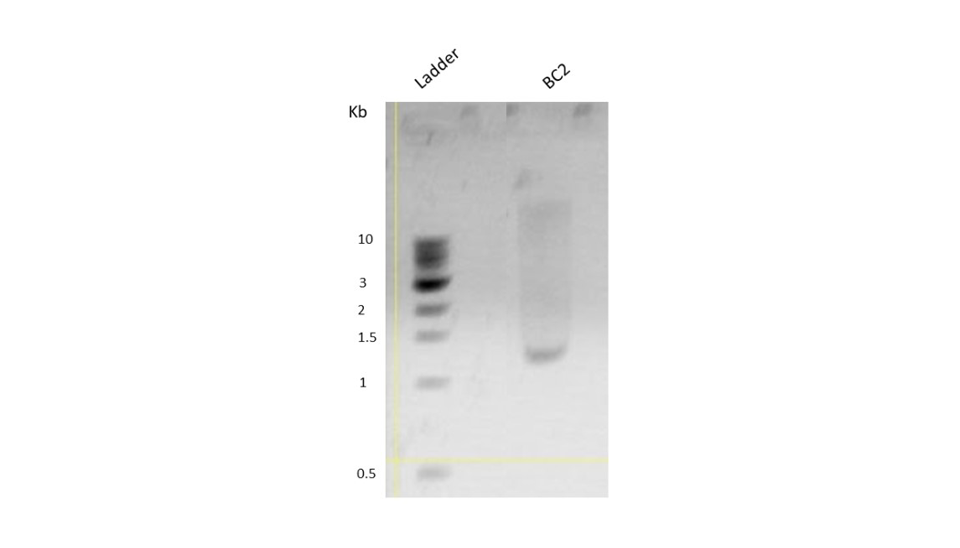
Figure 4. Agarose gel run showing successful PCR amplification.
PCR cleanup was then done using the Macherey-Nagel (MN) kit and the corresponding concentration was 61.5 ng/μL, measured using nanodrop.
PCR amplified product and pET28a vector were kept for restriction digestion overnight. Double digestion was carried out using the enzymes BamHI HF and HindIII HF received from NEB. A 20μL reaction was set up for a 1μg template in a cutsmart buffer. Single digestion of the vector was done using both BamHI HF and HindIII HF as the control. Protocols were obtained from NEB double digest calculator. The incubation was done at 37℃ overnight. Digested products were then run-on agarose gel and the image of the same is shown below (Fig. 5).
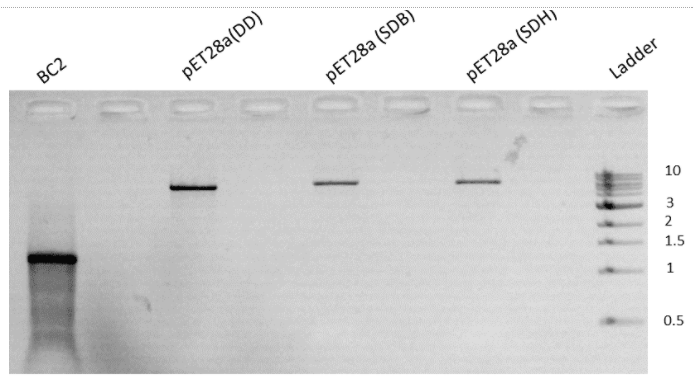
Figure 5. Agarose gel run showing digested product of BC2 & pet28a
Annotations
The size of the BC2 band obtained was larger than the expected value. It was observed that the restriction was not successful. Due to the same, experiments were repeated starting from PCR. Added to the reason was the low concentration of purified PCR products.
PCR of BC2 was done again with a slight modification, increasing the extension at 70℃ from 60 seconds to 80 seconds. The rest of the reaction conditions and methods were the same as earlier. A 1% agarose gel electrophoresis was performed. The PCR was successful and the gel image is as shown below (Fig. 6).
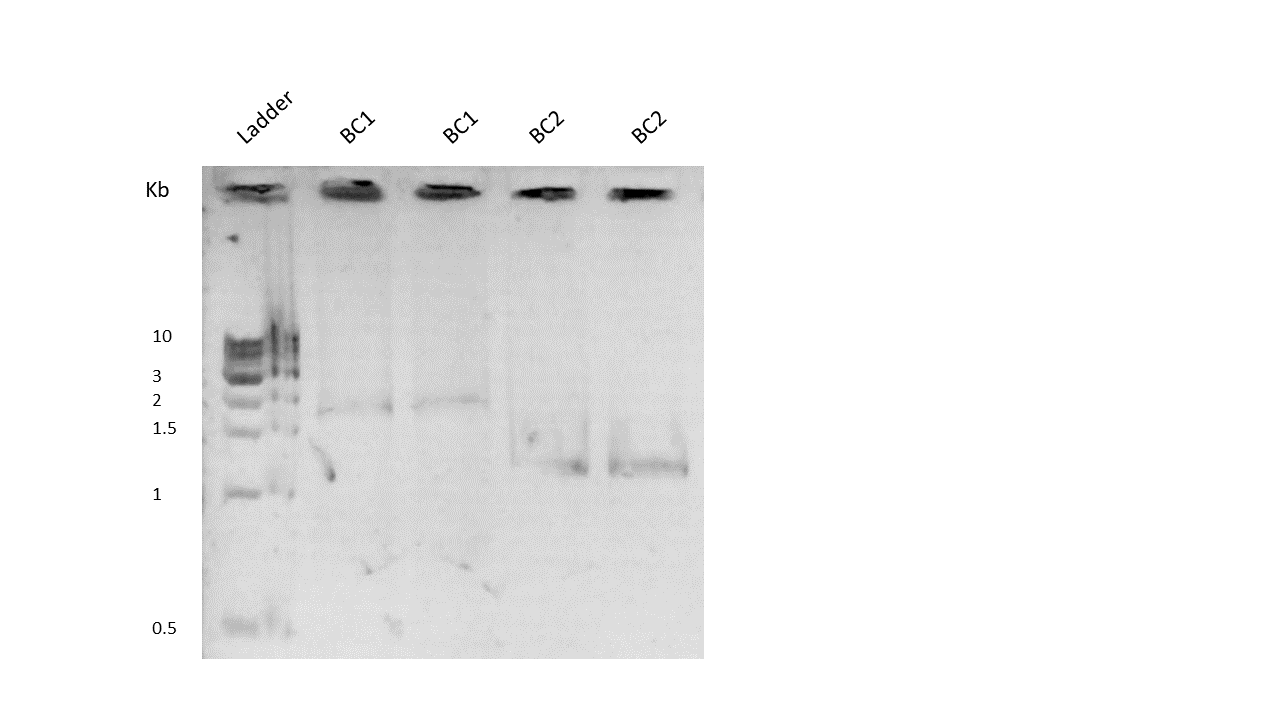
Figure 6. Agarose gel run showing successful PCR amplification
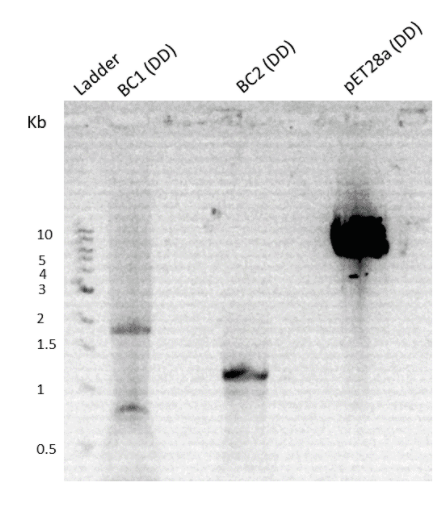
Figure 7. Agarose gel run showing digested product of BC2 & pet28a
Annotations
Gel elution was carried out from the restricted bands using the MN kit using the protocols mentioned in the kit. Concentrations of the vector and insert were 4.9 ng/μL and 65 ng/μL respectively. Using the eluted products, a ligation reaction was carried out. The reaction was set up for 20 μL with T4 DNA ligase. The reaction mixture contained 50 ng of vector and the calculations were made using an in-silico ligation calculator with the molar ratio of vector to insert as 1:3. It was incubated at 23°C for 1 hour.
The ligated product was then transformed into competent DH5α cells. We followed a standardized set of protocols for chemical transformation. Along with ligated BC2, digested vector (negative control1) and competent cells (control2) alone were also kept for transformation and plated. Plates were then incubated at 37°C overnight (Figure 8).
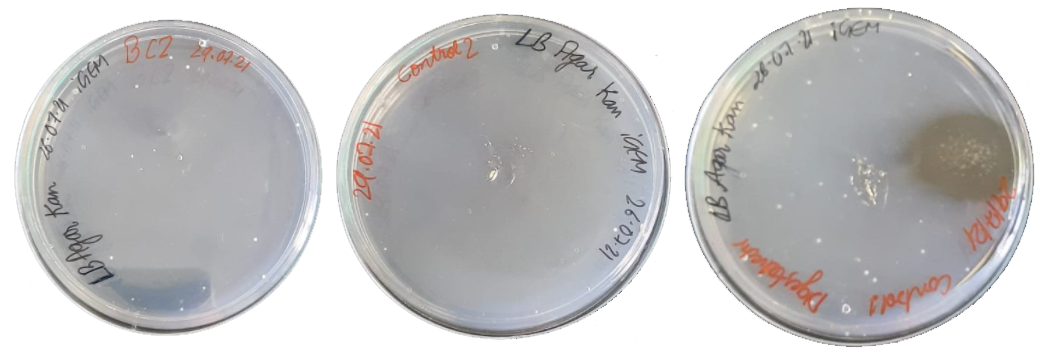
Figure 8. Transformed colonies of (a) cloned BC2 in DH5\(\alpha\) competent cells (b) Control 2: only competent DH5\(\alpha\) cells (c) Control 2: digested pet28a in DH5\(\alpha\) competent cell
To confirm the transformation, a colony PCR was performed using Taq-polymerase. For the BC2 construct cells and negative controls, T7 forward primer and gene-specific reverse primers were used. The melting temperature of the primers was 50°C and the extension time was set at 2 minutes. Colony PCR couldn't fetch proper results and the gel contained only genomic bands (Figure 9).
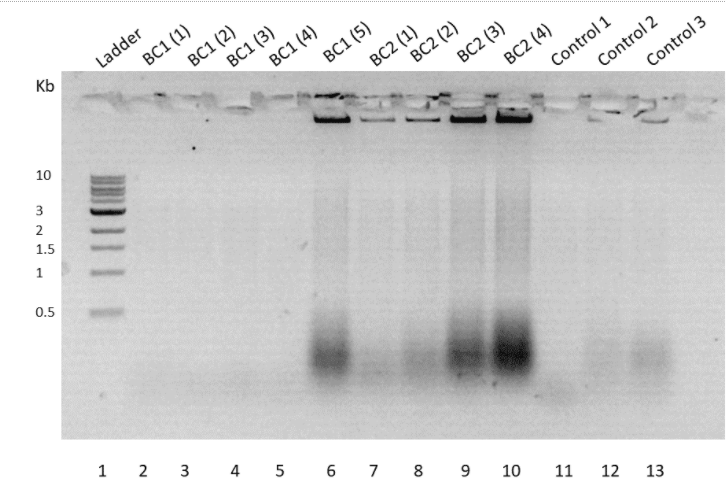
Figure 9. Agarose gel run of Colony PCR product
Next, we did the ligation again and did overnight ligation at 16°C. The ligated vector was then chemically transformed into Dh5-alpha cells (figure 10)
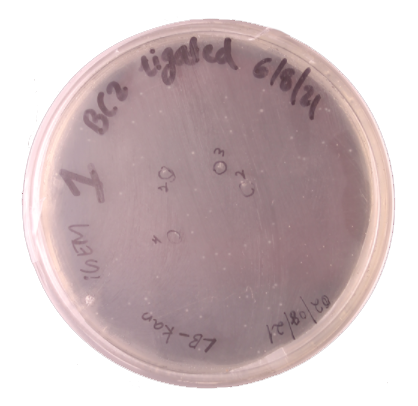
Figure 10. Transformed colony of cloned BC2 in DH5α competent cells
The transformed colonies were picked up for digestion confirmation. Plasmid isolation was done using the MN kit, following their protocols. Shown on the right is the gel image of restriction digestion (Figure 11).
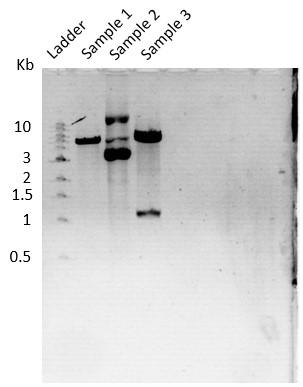
Figure 11. Agarose gel run of Digestion confirmation
Annotations
The plasmids were also verified using Sanger sequencing (Figure 12)
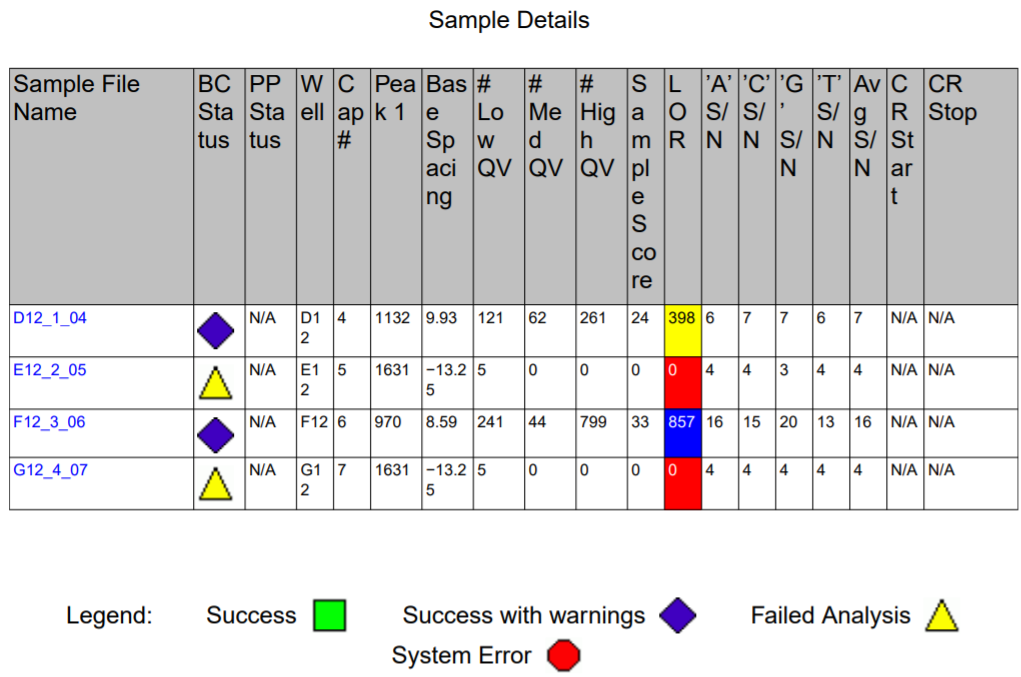
Figure 12. Sanger Sequencing result of cloned BC2
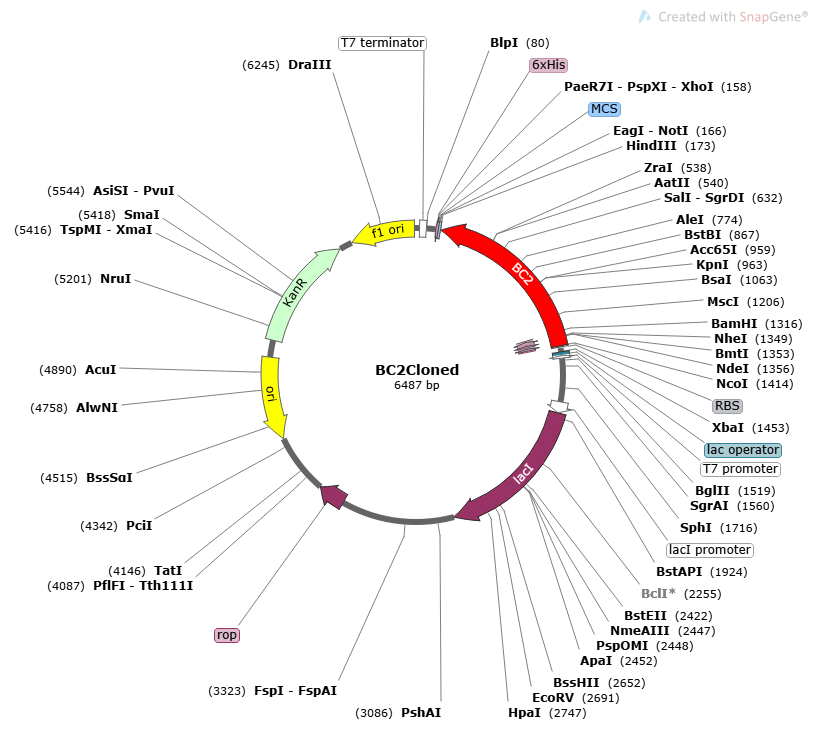
Figure 13. BC2 cloned in pET28a
Cloned vector is then transformed into the E. coli BL21(DE3) strain for expression (figure 14)

Figure 14. Transformed colonies of (a) Empty vector in BL21 cells (b) Cloned BC2 in BL21 cells (c) only BL21 cells
The general procedure followed for expression included a first primary inoculation followed by secondary inoculation and then SDS. Transformed BL21(DE3) cells were grown kanamycin-LB-plates and colonies were picked for inoculation. They were inoculated in 10 ml LB media with kanamycin (50 ng/μL) and incubated for 12 hours. It was then added to the secondary culture and IPTG was added once the OD value reaches 0.6. After IPTG addition, the culture was incubated and pellets down. Our first aim was to standardize the amount of IPTG to be added and the incubation time.
For this, we carried out IPTG induction and expression in different sets of IPTG concentrations and temperatures. Our experimental conditions were as follows:
The cells which were pellet down after IPTG induction were lysed and an SDS-PAGE was performed using the lysate (Figure 15). We could understand that our protein was getting expressed in all concentrations of IPTG and temperatures. We could specifically see a broader band in condition number 1, at the required size of 43.262 kDa. Hence, 1mM IPTG and 35℃ were chosen for further experiments downstream.
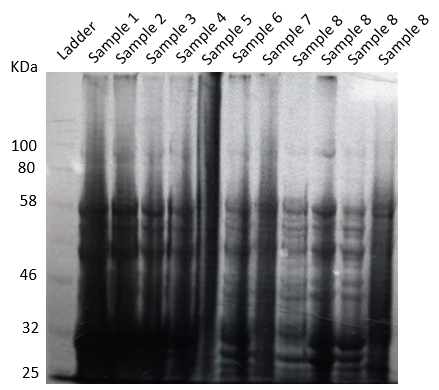
Figure 15. SDS PAGE result of IPTG induction and expression at different conditions.
Our next aim was to check whether the proteins are expressed in inclusion bodies or not. For this, the cells were induced using 1mM IPTG and kept for incubation at 35℃ for 5 hrs. Then the cells were lysed using sonication after adding the lysis buffer (50mM NaPB buffer pH 7, 500mM NaCl, 1mM PMSF, 0.05% beta mercaptoethanol, 5%glycerol, 0.5% triton X-100, 1X protease inhibitor). After centrifugation, both supernatant and pellets were mixed with the loading dye to perform 10% SDS-PAGE along with uninduced control and induced non-sonicated samples (Figure 16).
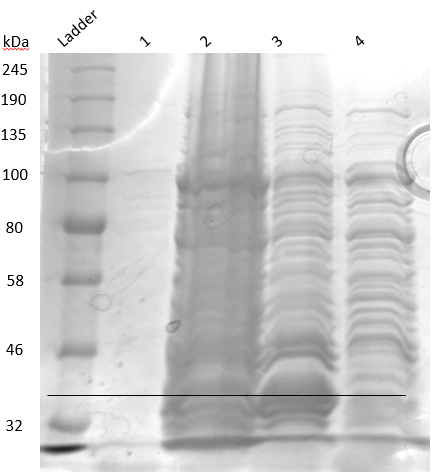
Figure 16. SDS PAGE result to check whether proteins are expressed in inclusion bodies or not when induced by 1mM IPTG and incubated at 35°C.
Annotations
We could understand that proteins were forming in the inclusion bodies. So, we decided to induce at a lower temperature of 16°C, since inducing the protein at lower temperature may cause the normal folding of proteins by giving it enough time to fold properly.
Inducing at 16°C followed by lysis using sonication. SDS result shows that protein is forming in cytoplasm as well as inclusion body. (Figure 17)
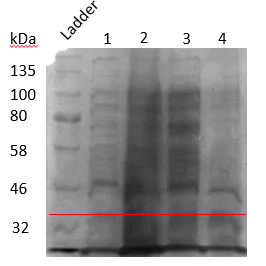
Figure 17. SDS PAGE results to check whether proteins are expressed in inclusion bodies or not when induced by 1mM IPTG and incubated at 16°C
Annotations
The expression of BC2 was thus standardized as mentioned above and our project reached the next goal, purification.
Secondary inoculum (1 liter) induced with 1mM IPTG and incubated overnight at 16°C was pelleted down at 13,000 RPM for 15 mins. Cells were resuspended in 50 ml lysis buffer (50 mM sodium phosphate buffer (pH 7), 1 mM PMSF, 0.5 M NaCl, 0.05 % BME, 5 % Glycerol, 0.5 % Triton X-100, 1 protease inhibitor tablet) and sonicated in pulse mode (30 seconds ON and 30 seconds OFF for 15 cycles with 55% amplitude). The supernatant was collected and loaded into Ni-NTA column pre-equilibrated with equilibration buffer (50 mM sodium phosphate buffer (pH 7), 1 mM PMSF, 0.5 M NaCl, 0.05 % BME, 5 % Glycerol, 0.5 % Triton X-100, 1 protease inhibitor tablet). It was then washed using 50 mL wash buffer (50 mM sodium phosphate buffer (pH 7), 0.5 mM NaCl, 1 mM EDTA) and eluted in 30 mL elution buffer (50 mM sodium phosphate buffer (pH 7), 0.5 mM NaCl, 1 mM EDTA, 250 mM Imidazole). Collected samples were analyzed using 13% SDS-PAGE (Figure 18).
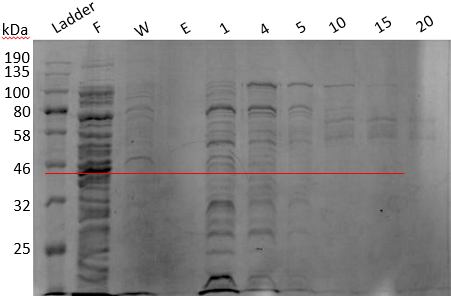
Figure 18. SDS PAGE result of Ni-NTA.
Annotations
From the gel, it was understood that our protein was coming along with the flowthrough at a band size of 43.262 kDa. We tried elution in NaPB buffer and also tried Ni-NTA from other manufacturers. All these series of experiments suggested that our 6xHis is somehow not able to bind to Ni-NTA, possibly due to its incorporation into protein tertiary structure. After a brief brainstorming session, we decided to perform urea dialysis for purifying BC2.
For performing urea dialysis, the cells were pelleted down after IPTG induction and lysed using lysis buffer (50 mM sodium phosphate buffer (pH 7), 1 mM PMSF, 0.5 M NaCl, 0.05 % BME, 5 % Glycerol, 0.5 % Triton X-100, 1 protease inhibitor tablet). The pellet was collected, washed twice with wash buffer (50mM, NaPB pH7, 0.5mM NaCl, 0.5% Triton X) followed by wash with 10mM CaCl2 and then pellets were resuspended in a extraction buffer containing 8M urea. This was done to denature the protein so as the 6X-His tag will get exposed leading to efficient binding of the protein to the column. After urea treatment, the supernatant was collected and loaded on the Ni NTA resin. When the eluted fraction was analyzed using SDS-PAGE, strong bands of the protein were visible. The gel image is shown below: (Figure 19).
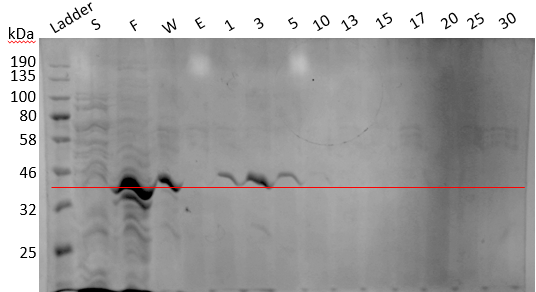
Figure 19. SDS PAGE result of Ni-NTA.
Annotations
We did stepwise dialysis, the denatured protein solution was first brought to equilibrium with a high denaturant concentration (buffer containing 6M Urea), then, the concentration was decreased and brought to equilibrium at a medium concentration (buffer containing 4M Urea) and, then, further decreased and brought to equilibrium at a low concentration (buffer containing 2M Urea). At last protein, the solution was brought to equilibrium with a buffer containing 0M urea. But the protein was found to be aggregating under prolonged dialysis for removing the urea. Hence, we adopted buffer exchange using protein concentrator columns as a fast method of removing urea. This method was also not successful in providing protein of good concentrations. To overcome this obstacle, we did some literature survey and found that ethanol precipitation method can be used for proteins that are aggregating during urea dialysis.
Following literature, a new batch of protein expression was started. The cells were lysed and the pellet was resuspended in NaPB buffer containing 8M urea. The Ni-NTA column was loaded with this solution and the column was eluted. SDS-PAGE was performed for knowing the fractions containing protein bands. The image of the PAGE gel showing protein bands is shown below: (Figure 20).
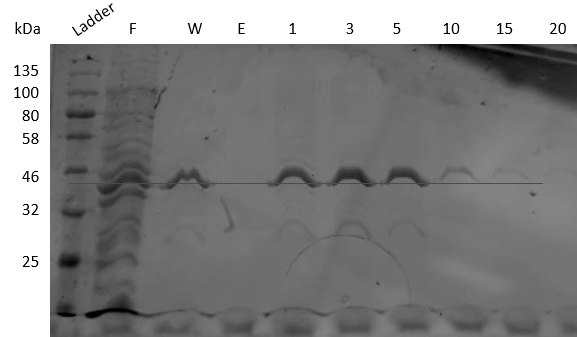
Figure 20. SDS PAGE result of Ni-NTA.
Annotations
To the fractions showing protein bands, we added 100% ice-cold ethanol and incubated the solution for 1 hour in -20 degree Celsius. This was followed by centrifugation for bringing down the precipitated protein. The obtained pellet was washed in 90% ethanol and special care was taken to remove the supernatant to the maximum possible extent. The washed pellet was resuspended in 1X PBS containing 0.1% SDS. While concentrating our protein, we did see aggregation when concentrated below 2 mL. Thus, we changed the composition of the buffer by adding stabilizers such as 10% glycerol and increasing the NaCl concentration to 200 mM [Final buffer composition: 1X PBS, 0.1%SDS, 200mM NaCl, and 10% glycerol]. This method was successful in obtaining good concentrations of protein having a tertiary structure, as was confirmed through CD spectroscopy.
We were able to successfully clone ST into the pET28a vector. The Streptomyces (ST) chitinase construct and corresponding primers were obtained from IDT. Upon receiving the construct and primers, both were dissolved in autoclaved Milli-Q water for a working concentration of 10ng/μL and 100uM respectively, as instructed by the manufacturer. The working stock of the same was 1 ng/μL and 10 uM, respectively.
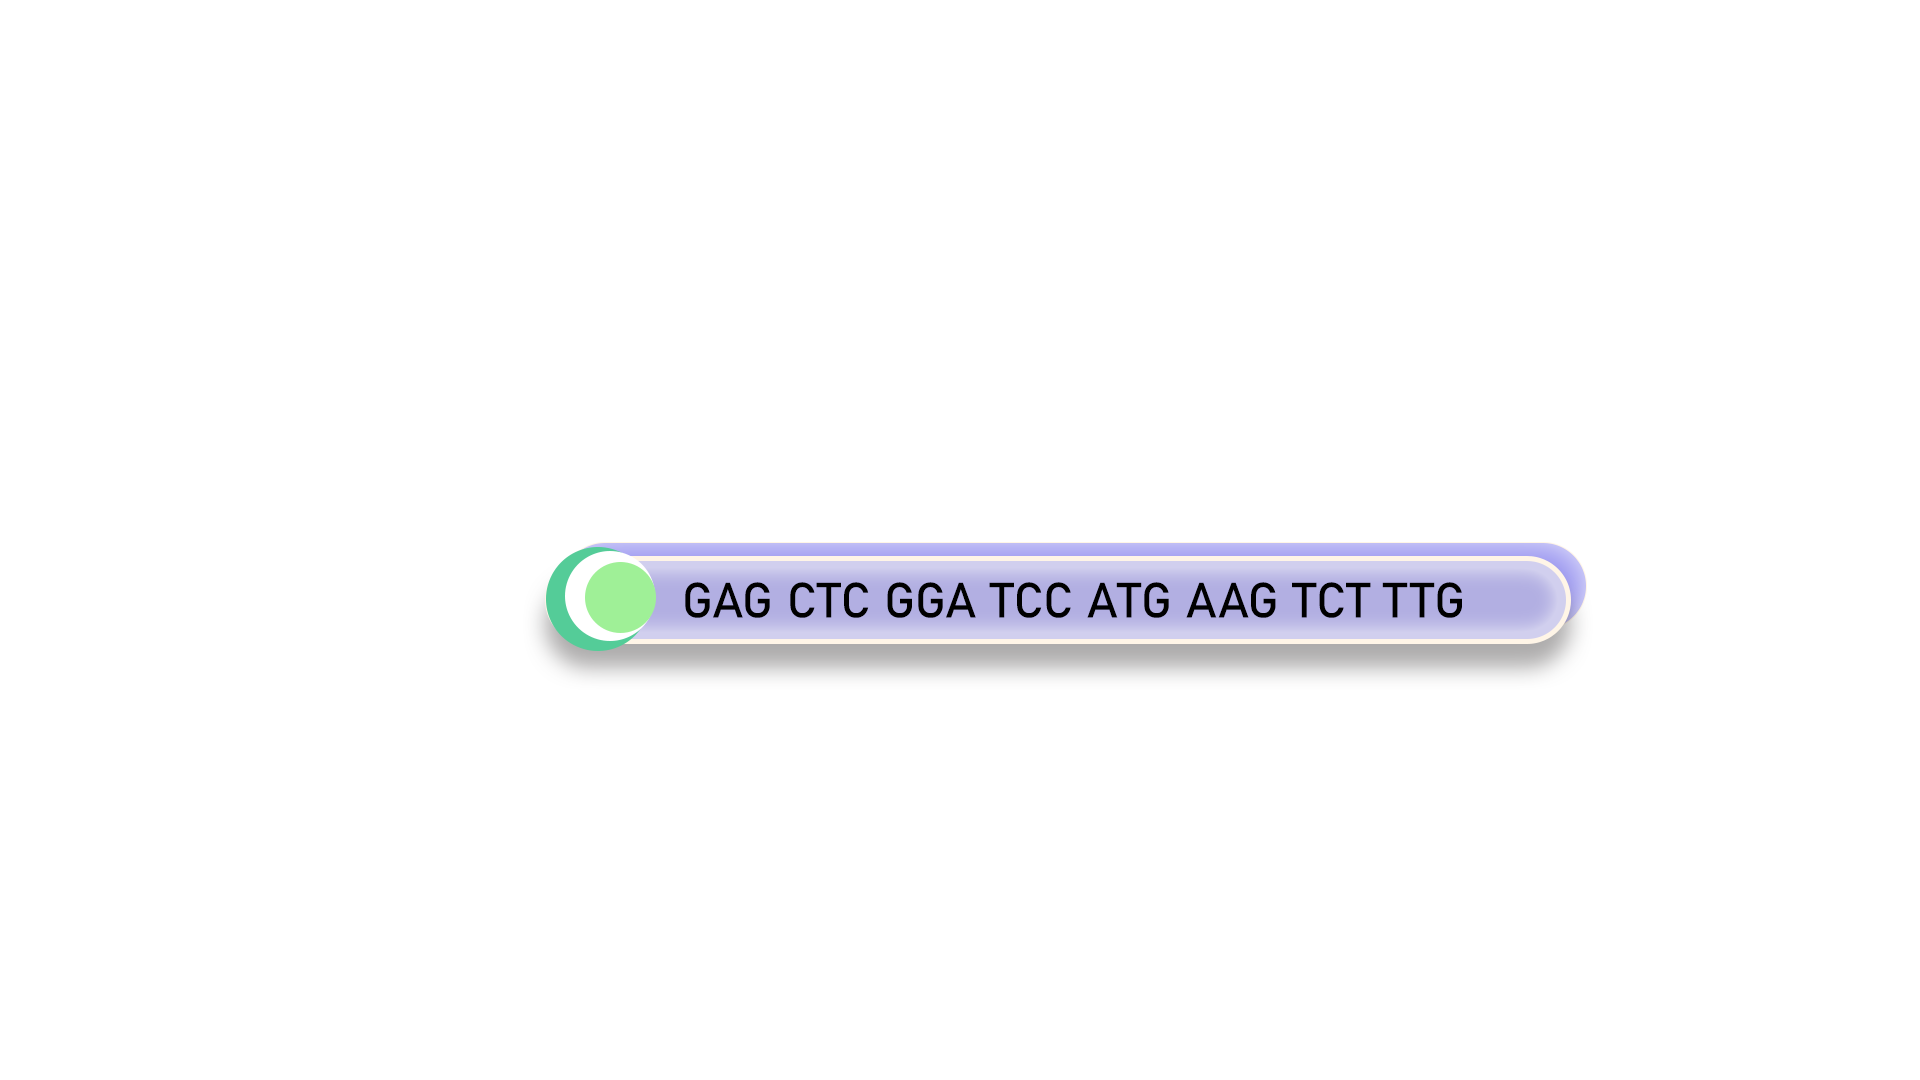
Figure 21. ChiA Forward Primer
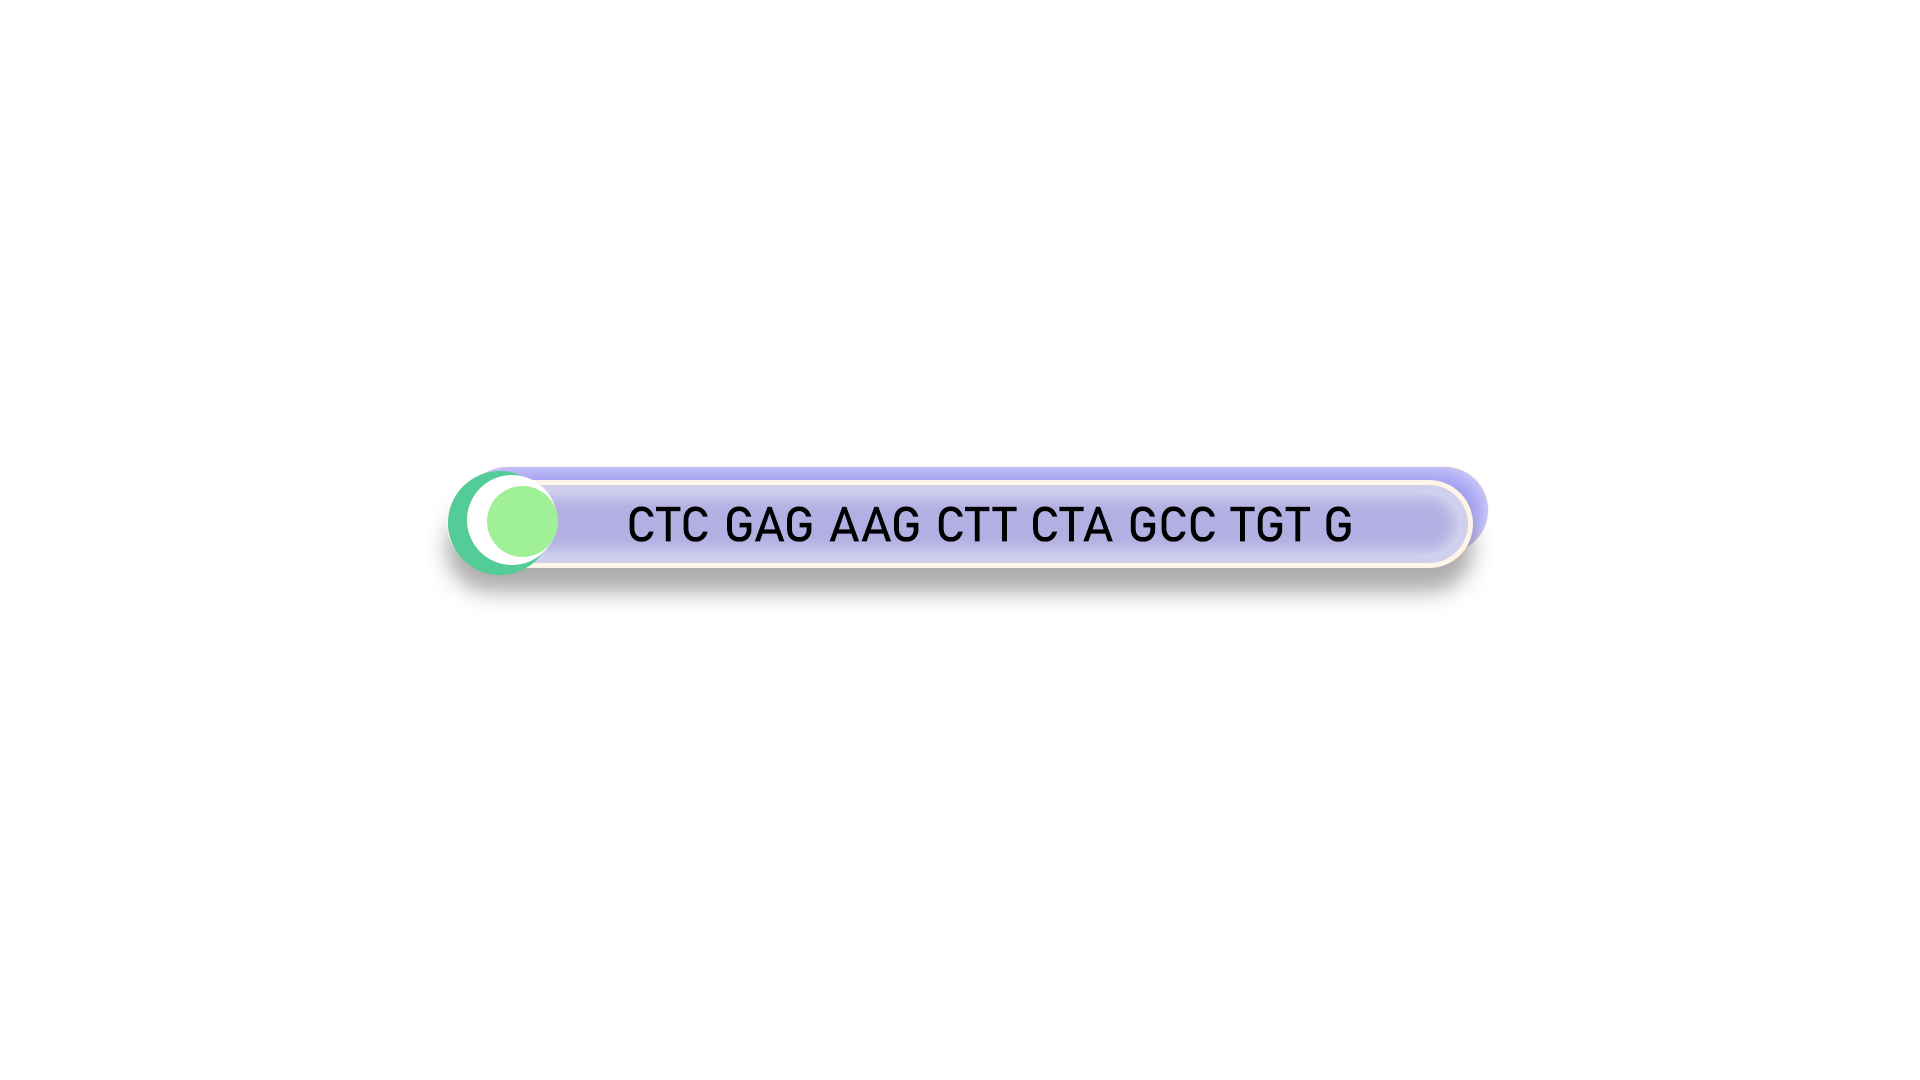
Figure 22. ChiA Reverse Primer
As the first step, we PCR amplified the ST construct using KOD polymerase. The melting temperature of the construct was 50℃. PCR conditions were standardized with an initial denaturation at 95℃ for 3 minutes, followed by 35 cycles of denaturation (95℃ for 20 seconds), primer annealing (50℃ for 20 seconds), and extension (70℃ for 2 minutes). The final extension was done at 72℃ for 5 minutes. The reaction volume was set at 50μL. PCR was confirmed by performing a 1% agarose gel electrophoresis. The gel image of the same is shown below (Fig.23).
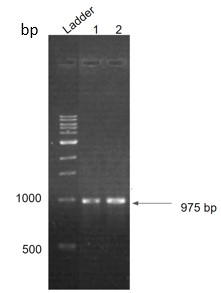
Figure 23. Agarose gel run showing successful PCR amplification
Annotations
PCR cleanup was then done using the Macherey-Nagel (MN) kit, and the corresponding concentration was 102 ng/μL, measured using nanodrop.
PCR amplified product and pET28a vector were kept for restriction digestion for 6.5 hours. Double digestion was carried out using the enzymes BamHI HF, and HindIII HF received from NEB. A 40μL reaction was set up for a 1μg template in a cutsmart buffer. Double digestion of the vector having BC2 was done using BamHI HF and HindIII HF as the control. Protocols were obtained from NEB double digest calculator. The incubation was done at 37℃ for 6.5 hours. Digested products were then run on agarose gel, and the image of the same is shown below (Figure.24).
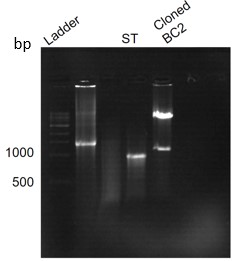
Figure 24. Agarose gel run showing successful digestion of ST and cloned BC2 with BC2 and pet28a band
Gel elution was carried out from the restricted bands using the MN kit using the protocols mentioned in the kit. Concentrations of the vector and insert were 17.9 ng/μL and 10.4 ng/μL, respectively. Using the eluted products, a ligation reaction was carried out. The reaction was set up for 20 μL with T4 DNA ligase. The reaction mixture contained 50 ng of vector, and the calculations were made using an in-silico ligation calculator with the molar ratio of vector to insert as 1:3. It was incubated at 23°C for 30 mins.
The ligated product was then transformed into competent DH5-alpha cells. We followed a standardized set of protocols for chemical transformation. Along with ligated ST, digested vector (negative control1) and competent cells (control2) alone were also kept for transformation and plated. Plates were then incubated at 37°C overnight.
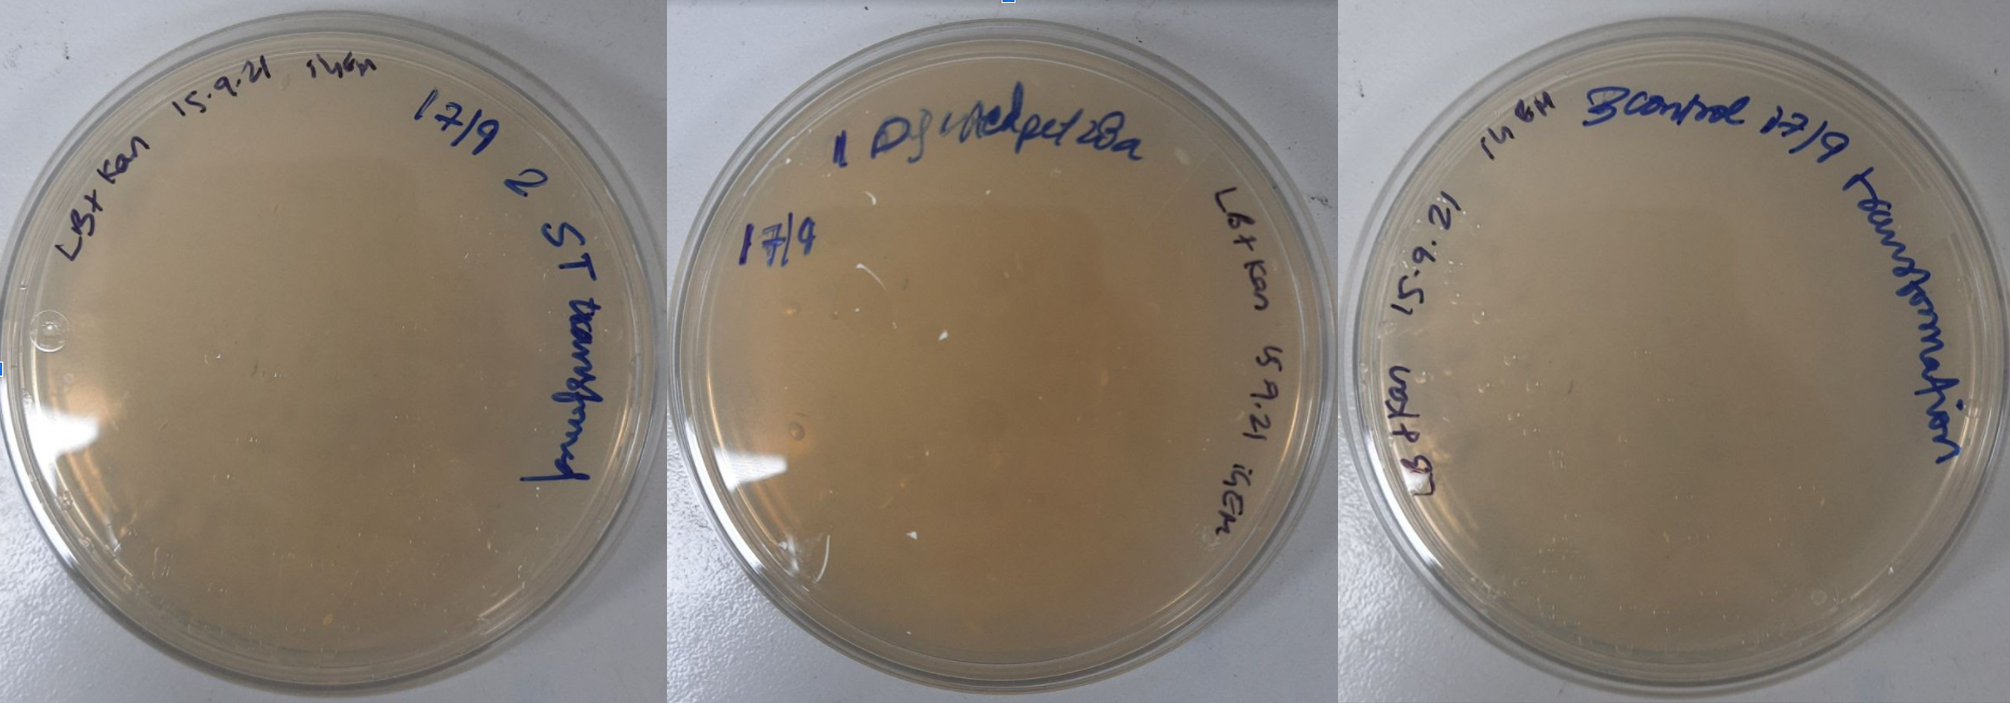
Figure 25. LB Plates plated with A. DH5alpha E coli. transformed with pet28a containing ST, 8-10 colonies; B. DH5alpha E coli. transformed with digested pet28a, no colonies; C. DH5alpha E coli. transformed without any vector, no colonies
To confirm the transformation, a colony PCR using Taq-polymerase was performed. Six colonies were picked for which, T7 forward primer and T7 terminator reverse primer were used for amplification. PCR conditions were standardized with an initial denaturation at 95℃ for 10 minutes, followed by 20 cycles of denaturation (95℃ for 30 seconds), primer annealing (50℃ for 30 seconds), and extension (72℃ for 3 minutes). The final extension was done at 72℃ for 10 minutes. The expected band size was around 1.3kb, including the 937 kb gene and the T7 promoter and T7 terminator. Cloned BC2 was used as a positive control.
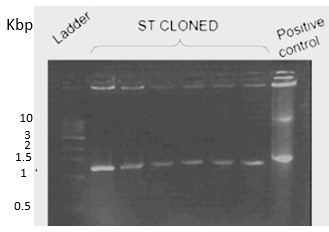
Figure 26. Colony PCR of ST
Annotations
Four of the 6 selected colonies were picked up for digestion confirmation. Plasmid isolation was done using the MN kit, following their protocols. Shown below is the gel image of restriction digestion (Figure 27).
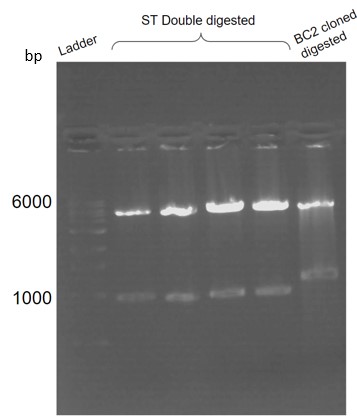
Figure 27. Restriction digestion confirmation of ST cloned in DH5alpha
Cloned vectors were then transformed into the E. coli BL21(DE3) strain for expression (Figure 6).
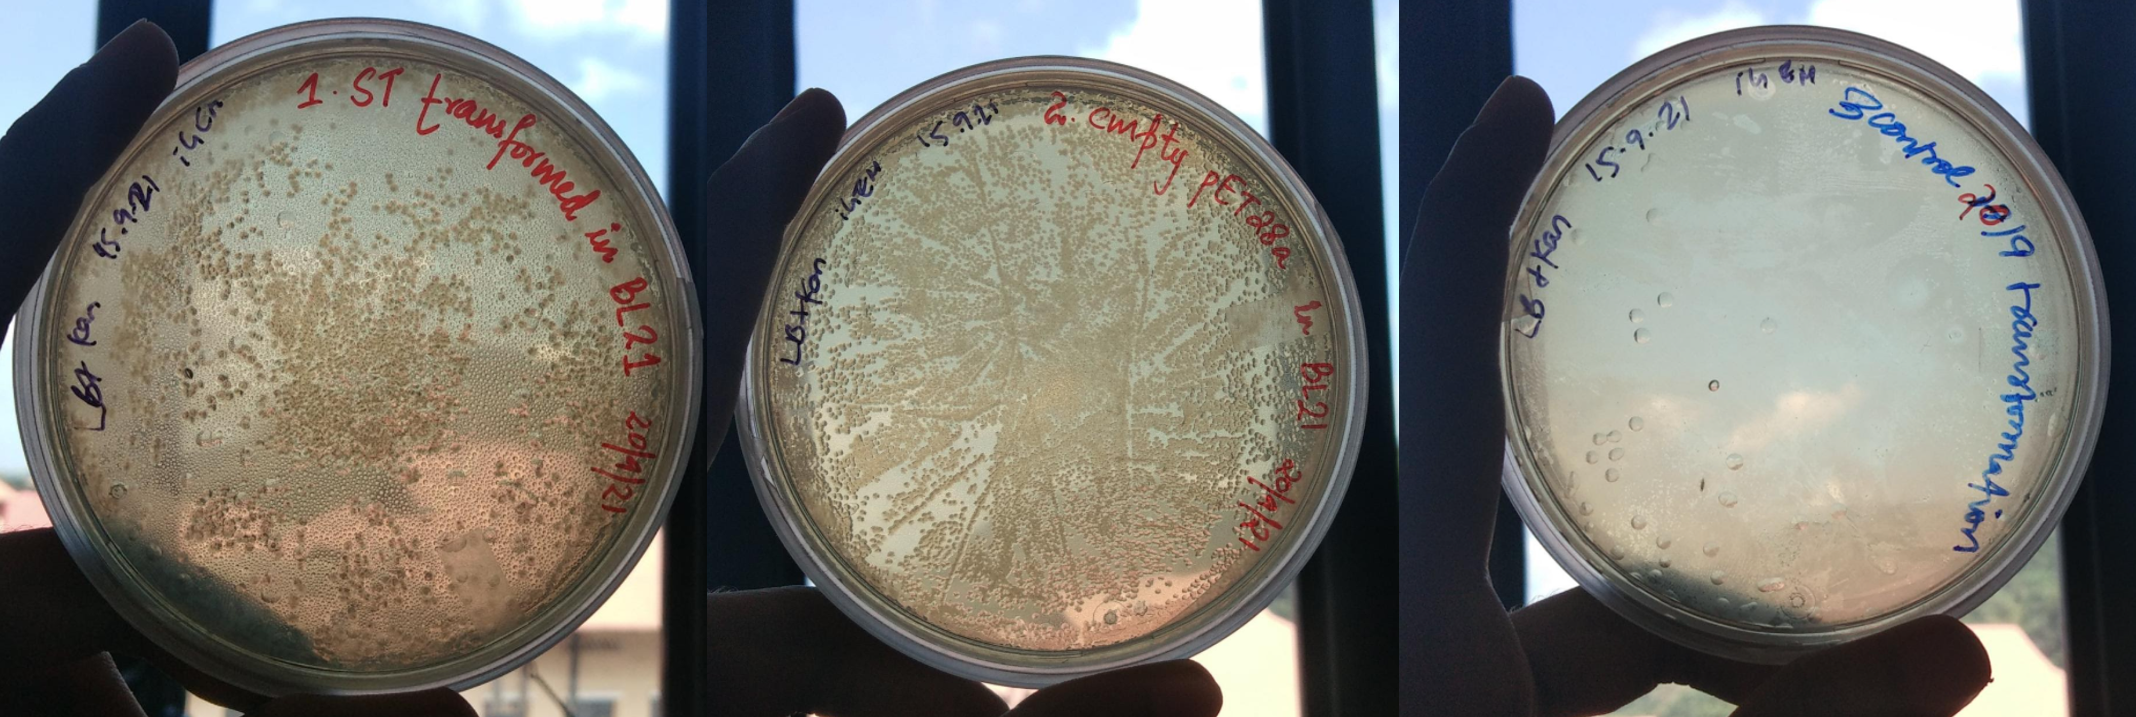
Figure 28. LB Plates plated with A. BL21(DE3) E coli. transformed with pet28a containing ST; B. BL21(DE3) E coli. transformed with empty pet28a; C. BL21(DE3) E coli. transformed without any vector
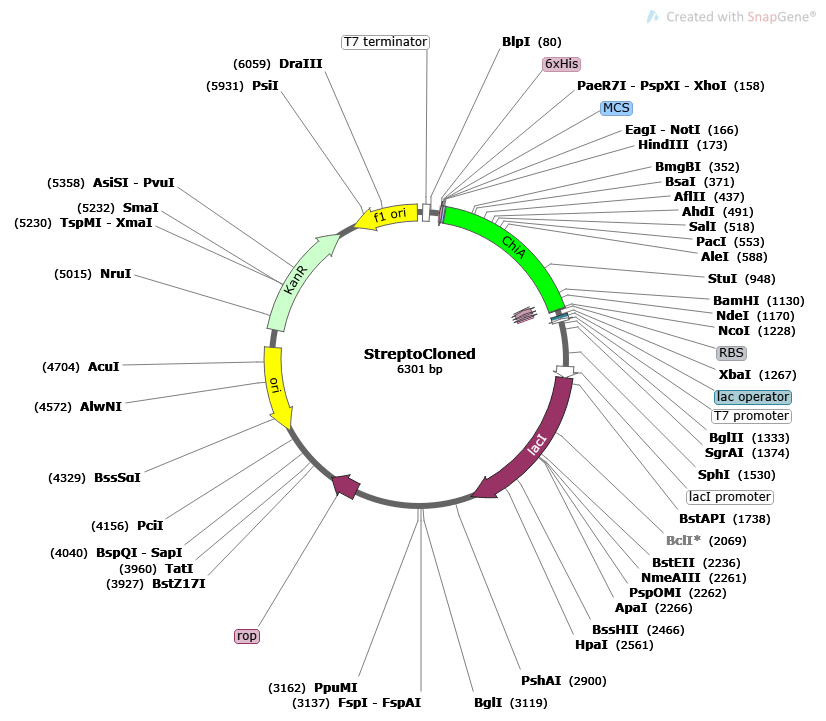
Figure 29. ChiA Cloned in pET28a.
From the transformed plate, four colonies were picked and restriction digestion was done using BamHI and HindIII to confirm the same. Glycerol stocks were made for the positive colonies.
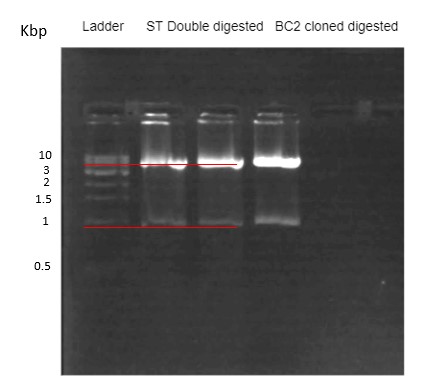
Figure 30. Restriction digestion confirmation
The general procedure followed for expression included a first primary inoculation followed by secondary inoculation and then SDS. Transformed BL21(DE3) cells were grown kanamycin-LB-plates and colonies were picked for inoculation. They were inoculated in 10 ml LB media with kanamycin (50 ng/μL) and incubated for 12 hours. It was then added to the secondary culture and IPTG was added once the OD value reaches 0.6. After IPTG addition, the culture was incubated and pellets down. Our first aim was to standardize the amount of IPTG to be added and the incubation time.
For this, we carried out IPTG induction and expression in different sets of IPTG concentrations and temperatures. We conducted a few sets of trial-and-error experimental conditions, four colonies were picked from which varied from a range of 16℃ to 37℃ and IPTG concentrations of 0.1 mM and 1 mM. From those, we could understand that our protein of interest was getting expressed at 37℃ and 1mM IPTG.
Secondary inoculum (1 liter) induced with 1mM IPTG and incubated for seven hours at 37°C was pelleted down at 11,000 RPM for 20 mins. Cells were resuspended in 50 ml lysis buffer (50 mM sodium phosphate buffer (pH 7), 1 mM PMSF, 0.5 M NaCl, 0.05 % BME, 5 % Glycerol, 0.5 % Triton X-100, 1 protease inhibitor tablet) and sonicated in pulse mode (30 seconds ON and 30 seconds OFF for 15 cycles with 55% amplitude). The supernatant was collected and loaded into Ni-NTA column pre-equilibrated with equilibration buffer (50 mM sodium phosphate buffer (pH 7), 1 mM PMSF, 0.5 M NaCl, 0.05 % BME, 5 % Glycerol, 0.5 % Triton X-100, 1 protease inhibitor tablet). It was then washed using 50 mL wash buffer (50 mM sodium phosphate buffer (pH 7), 0.5 mM NaCl, 1 mM EDTA) and eluted in 30 mL elution buffer (50 mM sodium phosphate buffer (pH 7), 0.5 mM NaCl, 1 mM EDTA, 250 mM Imidazole). Collected samples were analyzed using 12% SDS-PAGE (Figure 31).
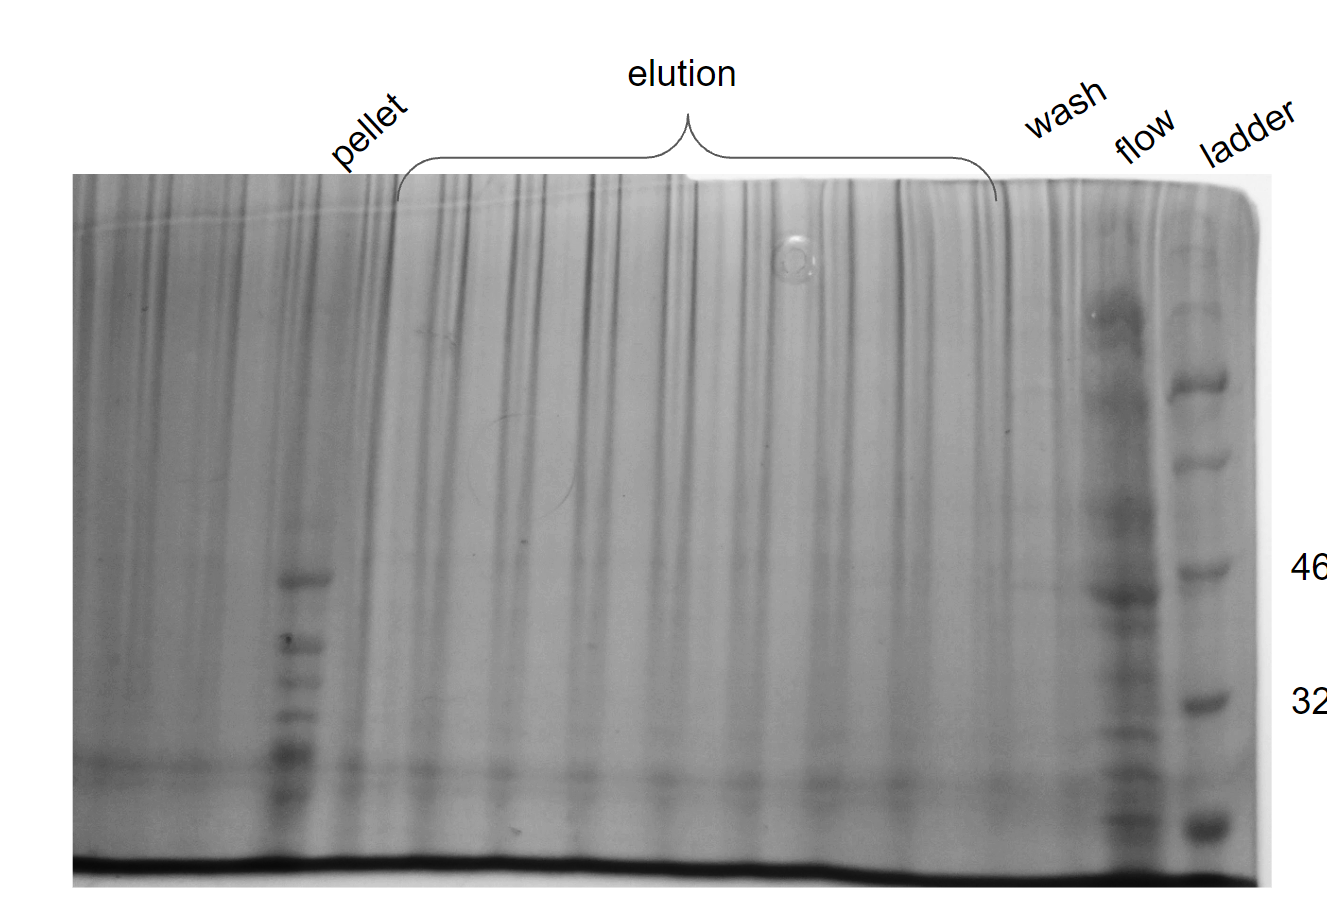
Figure 31. Ni-NTA of Lysate (supernatant) of transformed BL21(DE3) with pet28a cloned with ST
From the gel, it was understood that our protein came only in the pellet obtained after lysis and not in fractions collected after Ni-NTA purification. The lysed pellet had protein with a band size of 36.67 kDa.
Due to lack of time, we couldn’t standardize the purification of native protein via Ni-NTA. We proceeded with urea treatment to expose the His-tag if hidden. For that, the cells were pelleted down after IPTG induction and lysed using lysis buffer (50 mM sodium phosphate buffer (pH 7), 1 mM PMSF, 0.5 M NaCl, 0.05 % BME, 5 % Glycerol, 0.5 % Triton X-100, 1 protease inhibitor tablet). The pellet was collected, washed twice with a wash buffer followed by a wash with CaCl2 and then pellets were resuspended in an extraction buffer containing 8M urea. This was done to denature the protein so as the 6X-His tag will get exposed, leading to efficient binding of the protein to the column. After urea treatment, the supernatant was collected and loaded on the Ni NTA resin. When the eluted fractions were analyzed using SDS-PAGE, strong protein bands were visible in fractions 1 & 3. The gel image is shown below (Figure 32).
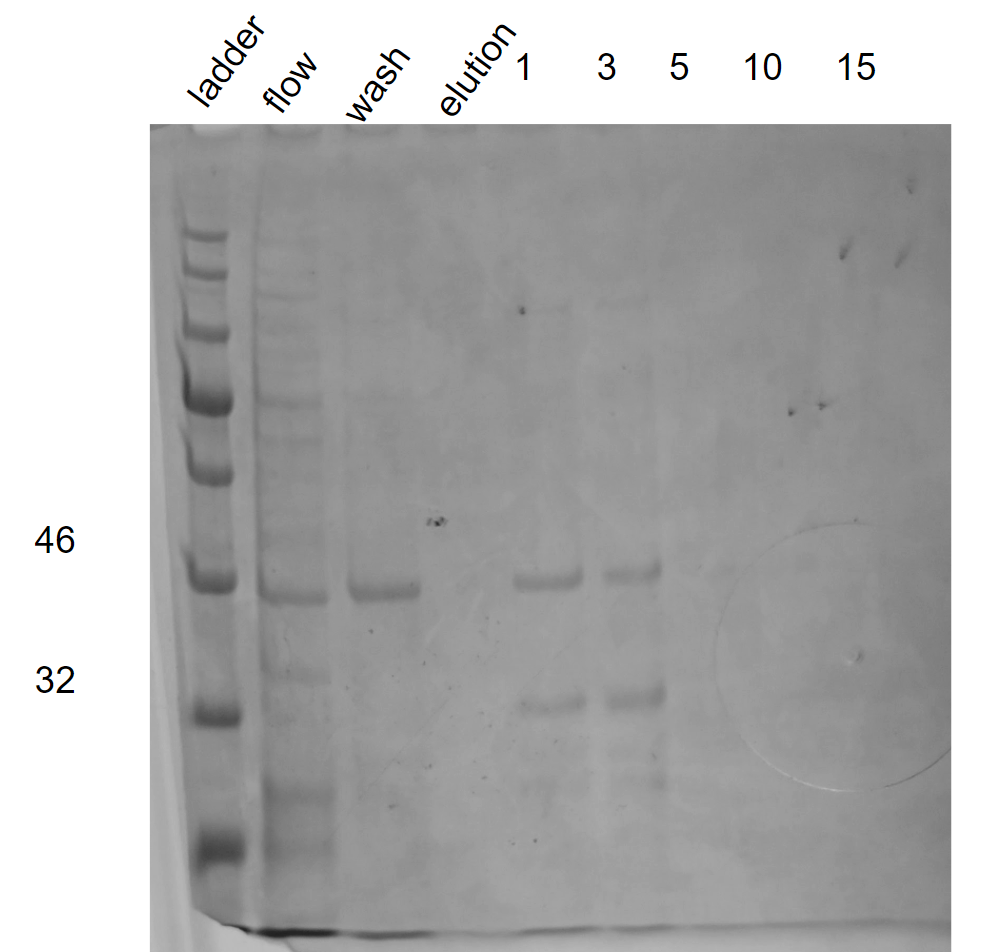
Figure 32. Ni-NTA of urea treated Lysate (pellet) of transformed BL21(DE3) with pet28a cloned with ST
To the fractions showing protein bands, we added 100% ice-cold ethanol and incubated the solution for 1 hour in -20 degrees Celsius. This was followed by centrifugation for bringing down the precipitated protein. The obtained pellet was washed in 90% ethanol, and special care was taken to remove the supernatant to the maximum possible extent. The washed pellet was resuspended in 1X PBS containing 0.1% SDS, 200mM NaCl and 10% glycerol.After purifying the protein, we first measured the concentration of the enzyme using nanodrop. To make the protein concentration accurate, we imputed the protein’s dielectric constant and molecular weight (predicted by ProtParam). Then, we concentrated the protein using an amicon filter to 0.749 mg/ml.